7 Powerful Forensics-Ready Telemetry Patterns
Modern “observability” answers: Is the service up?
Forensics-ready telemetry answers: Who did what, when, from where, using which identity, and what changed?
Cyber Rely has already been publishing engineering-first, forensics-ready patterns across microservices, CI/CD, APIs, and SaaS logging—this post connects the dots into a concrete telemetry design you can ship.

Just published: Reprompt (parameter-to-prompt) prompt injection is a confused-deputy risk in AI assistants. Here are 7 practical fixes—intent gating, strict parsing, tool hardening, retrieval isolation, and egress controls.
Read the full guide → Reprompt / URL-to-Prompt Prompt Injection
What forensics-ready telemetry means in distributed systems
Forensics-ready telemetry is complete enough to reconstruct a timeline and consistent enough to correlate across systems—even when the incident spans:
- Web + API + worker queues
- Multiple microservices and data stores
- CI/CD deployments and config changes
- OAuth / SSO and session activity
The minimum event types you should model
Use a small, stable taxonomy (engineers will actually follow it):
- Request/Response events (edge + service entry)
- Auth events (login, token refresh, MFA, privilege changes)
- Data access events (read/export/bulk queries; sensitive object access)
- Admin/config change events (feature flags, secrets, IAM, webhooks)
- CI/CD provenance events (build/deploy identity, artifact digests)
- Security control events (WAF blocks, rate limits, policy decisions)
A practical “forensics event” shape (JSON)
{
  "ts": "2026-02-05T10:15:30.123Z",
  "event_type": "auth.token.refresh",
  "severity": "info",
  "service": "auth-service",
  "env": "prod",
  "trace_id": "4bf92f3577b34da6a3ce929d0e0e4736",
  "span_id": "00f067aa0ba902b7",
  "request_id": "req_01J2KQ9Q9B5K2XQ4T8",
  "actor": { "user_id": "u_12345", "tenant_id": "t_7788", "role": "admin" },
  "client": { "ip": "203.0.113.10", "ua": "Mozilla/5.0", "device_id": "dvc_9a2b" },
  "auth": { "idp": "okta", "amr": ["pwd","mfa"], "session_id": "s_abc" },
  "action": { "target": "refresh_token", "outcome": "success" },
  "evidence": { "token_kid": "kid_7", "rotated": true },
  "build": { "release": "2026.02.05.3", "commit": "c0ffee", "artifact": "sha256:..." }
}
Rule of thumb: if your incident handler can’t build a timeline from these events alone, you don’t have forensics-ready telemetry.
Structured logging standards that accelerate investigations
1) Enforce a schema (don’t “hope” for consistency)
Create a JSON Schema (or an internal contract) and validate in CI.
Minimal schema (illustrative)
{
  "required": ["ts","event_type","service","env","severity","trace_id","request_id","action"],
  "properties": {
    "ts": { "type": "string" },
    "event_type": { "type": "string" },
    "service": { "type": "string" },
    "env": { "type": "string" },
    "severity": { "type": "string" },
    "trace_id": { "type": "string" },
    "request_id": { "type": "string" },
    "actor": { "type": "object" },
    "client": { "type": "object" },
    "action": { "type": "object" },
    "build": { "type": "object" }
  }
}
2) Make correlation IDs non-negotiable
Always log:
trace_id,span_id(distributed tracing)request_id(edge correlation)tenant_idand stableuser_id(or hashed)release/commit(so you can answer: what code was running?)
3) Keep logs immutable enough to trust
For investigations, your logging storage must resist “oops, it got deleted.”
Example: “append-only” retention intent (Terraform-ish)
# Illustrative: implement object lock / WORM where supported
resource "log_archive_bucket" "prod" {
  name        = "prod-log-archive"
  versioning  = true
  object_lock = true
  retention_days = 180
}
Designing forensics-ready telemetry for microservices
Pattern: propagate context everywhere
At the edge, generate/accept correlation IDs, then propagate them across:
- HTTP headers
- message queues
- background jobs
Node.js (Express) middleware: request_id + safe context
import crypto from "crypto";

export function telemetryContext(req, res, next) {
  const incoming = req.header("x-request-id");
  req.requestId = incoming || `req_${crypto.randomUUID()}`;

  // IMPORTANT: avoid logging raw secrets/tokens
  req.actor = {
    user_id: req.user?.id || null,
    tenant_id: req.user?.tenantId || null
  };

  res.setHeader("x-request-id", req.requestId);
  next();
}
Node.js structured log helper (JSON)
export function logEvent(logger, req, event) {
  logger.info({
    ts: new Date().toISOString(),
    service: process.env.SVC_NAME,
    env: process.env.ENV,
    severity: event.severity || "info",
    event_type: event.event_type,
    request_id: req.requestId,
    trace_id: req.traceId,     // set by your tracing middleware
    span_id: req.spanId,
    actor: req.actor,
    client: { ip: req.ip, ua: req.headers["user-agent"] },
    action: event.action,
    evidence: event.evidence || {},
    build: { release: process.env.RELEASE, commit: process.env.COMMIT }
  });
}
Python (FastAPI) middleware: correlation + structured logging
import uuid
import json
from datetime import datetime
from fastapi import Request

async def telemetry_context(request: Request, call_next):
    request_id = request.headers.get("x-request-id") or f"req_{uuid.uuid4()}"
    request.state.request_id = request_id
    response = await call_next(request)
    response.headers["x-request-id"] = request_id
    return response

def log_event(event: dict):
    payload = {
        "ts": datetime.utcnow().isoformat() + "Z",
        "service": "api-service",
        "env": "prod",
        **event
    }
    print(json.dumps(payload, separators=(",", ":")))
Pattern: capture “user context” without leaking sensitive data
- Log stable identifiers (user ID, tenant ID), not PII.
- Redact secrets automatically.
Redaction helper (Python)
SENSITIVE_KEYS = {"password","pass","token","authorization","cookie","secret","api_key"}

def redact(obj):
    if isinstance(obj, dict):
        return {k: ("[REDACTED]" if k.lower() in SENSITIVE_KEYS else redact(v)) for k,v in obj.items()}
    if isinstance(obj, list):
        return [redact(x) for x in obj]
    return obj
Integrating telemetry with incident response workflows
Forensics-ready telemetry becomes actionable when it feeds the IR loop:
- Detect: suspicious event patterns (impossible travel, token replay, bulk export)
- Triage: pivot by
trace_id,user_id,session_id,device_id,release - Contain: revoke sessions/keys; block risky IPs; disable compromised webhooks
- Investigate: build a timeline; prove scope; identify root cause
- Remediate: fix control gaps; add tests so it doesn’t regress
If you want an external validation of telemetry gaps before an incident, pair this with a Risk Assessment and a Remediation plan.
- Risk Assessment: https://www.pentesttesting.com/risk-assessment-services/
- Remediation Services: https://www.pentesttesting.com/remediation-services/
And when an incident hits, DFIR support depends on the evidence your telemetry preserves:
- Digital Forensic Analysis Services: https://www.pentesttesting.com/digital-forensic-analysis-services/
“Timeline builder” (real-time triage helper)
This script turns JSON logs into a sorted incident timeline (pivot by user/session/request).
import json, sys
from datetime import datetime

def parse_ts(s):
    # expects ISO8601-ish
    return datetime.fromisoformat(s.replace("Z","+00:00"))

needle_user = sys.argv[1] if len(sys.argv) > 1 else None

events = []
for line in sys.stdin:
    try:
        e = json.loads(line)
        if needle_user and e.get("actor", {}).get("user_id") != needle_user:
            continue
        events.append(e)
    except Exception:
        continue

events.sort(key=lambda e: parse_ts(e["ts"]))

for e in events:
    actor = e.get("actor", {})
    print(f'{e["ts"]} {e.get("event_type")} user={actor.get("user_id")} tenant={actor.get("tenant_id")} req={e.get("request_id")} trace={e.get("trace_id")}')
Telemetry health checks (so observability stays useful)
Most teams start strong—then drift. Add guardrails:
1) CI schema validation
Fail builds if telemetry contracts break.
# pseudo: validate sample logs against schema in CI
python scripts/validate_logs.py --schema schemas/forensics_event.schema.json --samples samples/logs.jsonl
2) Runtime “telemetry canary”
A scheduled synthetic request should generate:
- edge log
- service log
- trace
- (optional) audit event
…and alert if any component goes missing.
3) Telemetry SLOs (yes, for logging)
Track:
- % requests with
request_id - % events with
trace_id - ingestion lag (p95)
- dropped log rate
- audit event coverage for sensitive actions
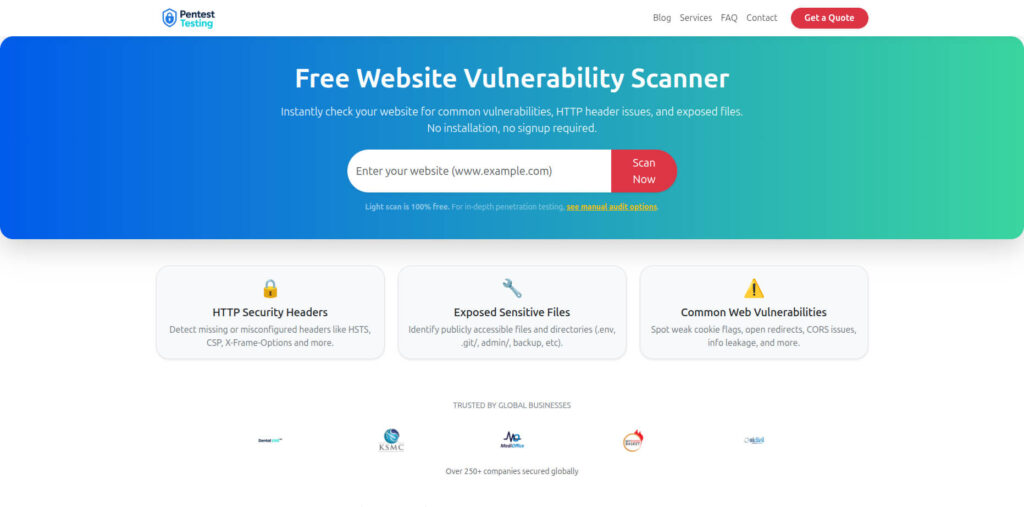
Free Website Vulnerability Scanner tool by (Pentest Testing Corp)

Link to tool: https://free.pentesttesting.com/
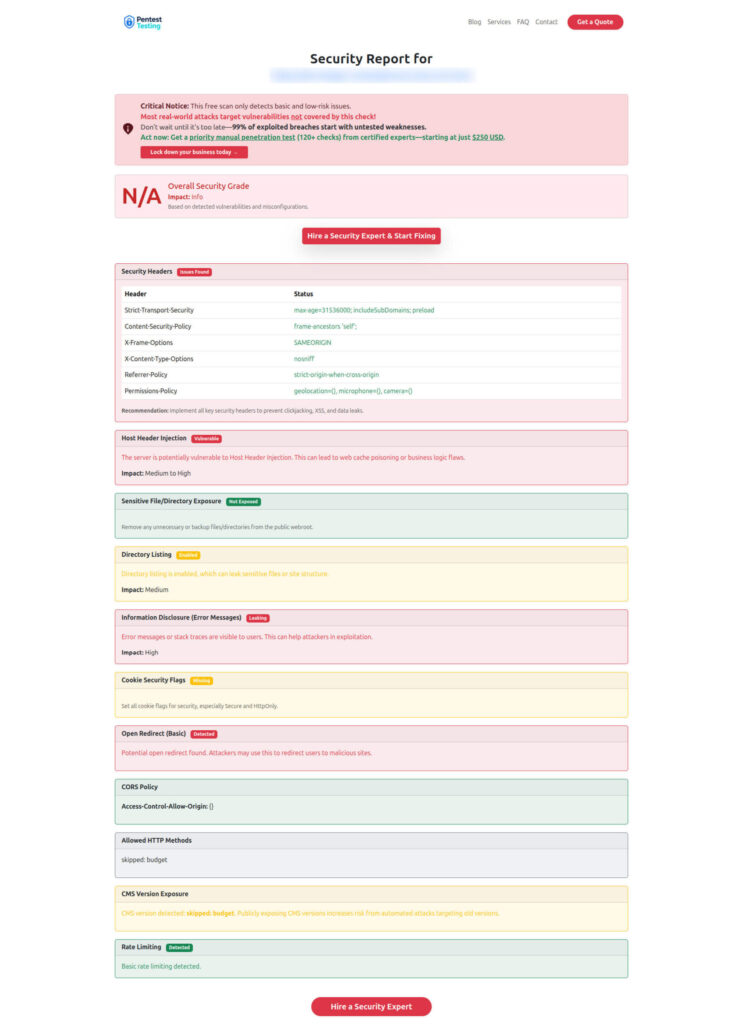
Sample report from the tool to check Website Vulnerability

Recent Cyber Rely posts to read next (internal)
Use these as “companion” patterns while implementing forensics-ready telemetry:
- https://www.cybersrely.com/forensics-ready-microservices-design-patterns/
- https://www.cybersrely.com/security-chaos-experiments-for-ci-cd/
- https://www.cybersrely.com/non-human-identity-security-controls/
- https://www.cybersrely.com/software-supply-chain-security-tactics/
- https://www.cybersrely.com/mongobleed-cve-2025-14847-mongodb-patch-playbook/
🔐 Frequently Asked Questions (FAQs)
Find answers to commonly asked questions about Forensics-Ready Telemetry Patterns.