10 Essential Steps: Developer Playbook for DORA
DORA is now real life, not a future slide. For financial entities and their critical ICT providers, regulators expect you to prove digital operational resilience across incident management, testing, and third-party risk — not just say you have a plan
This Developer Playbook for DORA translates those obligations into a concrete engineering backlog you can actually ship before your next ICT incident drill.
You’ll get:
- 10 engineering tasks you can turn into Jira tickets.
- Practical code for logs, SLOs, CI/CD resilience tests, and evidence exports.
- Natural integration points with:
- Cyber Rely for developer-first guidance.
- Pentest Testing Corp Risk Assessment Services and Remediation Services for formal, DORA-aligned assurance.
- The free Website Vulnerability Scanner to seed your backlog with real exposure data.

For a deeper, practical guide on operationalizing AI security testing, check out our follow-up article: 5 Proven Ways to Use LLM Pentest Agents in CI Safely, where we show how to plug LLM pentest agents into GitHub Actions, lock them to staging, and turn their findings into developer-ready tickets.
Quick recap: what DORA expects (in developer terms)
DORA’s core pillars map nicely to work you already do:
- ICT risk management & governance → defended-by-default architectures with clear ownership.
- ICT incident management & reporting → structured incidents, rich logs, repeatable reports under strict timelines.
- Digital operational resilience testing → drills, technical tests, and scenario-based exercises (think TLPT-style events).
- Third-party risk & oversight → visibility, controls, and evidence for critical ICT providers.
This playbook focuses on what engineering teams must ship before the next ICT incident drill so that:
- Drills feel like running a practiced playbook, not a live-fire chaos session.
- You can export regulator-grade evidence on demand.
- Risk assessments and remediation projects have solid telemetry to build on.
10 engineering tasks to ship before your next ICT incident drill
1. Standardize incident logging with a DORA-ready schema
DORA expects you to quickly reconstruct “what happened, to whom, and for how long.” That’s impossible without structured, consistent logs.
Backlog item: Define a JSON log schema for all critical services and enforce it via logging wrappers.
Example (TypeScript + pino-style logging):
// logging.ts
import pino from "pino";

export type IncidentLogContext = {
  incidentId?: string;
  service: string;
  component: string;
  tenantId?: string;
  customerSegment?: string;
  requestId: string;
  severity: "INFO" | "WARN" | "ERROR" | "CRITICAL";
};

const baseLogger = pino({
  level: process.env.LOG_LEVEL || "info",
  formatters: {
    level(label) {
      return { level: label.toUpperCase() };
    },
  },
});

export function incidentLogger(ctx: IncidentLogContext) {
  return baseLogger.child({
    incidentId: ctx.incidentId || null,
    service: ctx.service,
    component: ctx.component,
    tenantId: ctx.tenantId || null,
    customerSegment: ctx.customerSegment || null,
    requestId: ctx.requestId,
  });
}

// usage in a handler
export async function handlePayment(req, res) {
  const log = incidentLogger({
    service: "payments-api",
    component: "checkout-handler",
    requestId: req.headers["x-request-id"],
    severity: "INFO",
  });

  log.info({ event: "checkout_started" });

  try {
    // ...
  } catch (err) {
    log.error({
      event: "checkout_failed",
      errorType: err.name,
      errorMessage: err.message,
    });
    throw err;
  }
}
Checklist:
- Every log line includes service, component, requestId, and tenant/customer context.
- Incident IDs can be attached later when a drill escalates to a “major” incident.
- Logs are shipped to a central store with retention aligned to your DORA evidence policy.
2. Implement a machine-readable incident classification engine
DORA requires consistent incident classification (major vs. significant vs. minor) with clear thresholds. Your incident drill will go smoother if classification is code, not opinion.
Backlog item: Create a small service or script that classifies incidents based on impact metrics.
Example (Python classification helper):
# classify_incident.py
from dataclasses import dataclass
from enum import Enum

class Severity(str, Enum):
    MAJOR = "major"
    SIGNIFICANT = "significant"
    MINOR = "minor"

@dataclass
class Impact:
    availability_minutes: int
    customers_impacted: int
    data_exfiltration: bool

def classify(impact: Impact) -> tuple[Severity, list[str]]:
    reasons = []
    if impact.availability_minutes >= 60:
        reasons.append(">= 60 min outage")
    if impact.customers_impacted >= 1000:
        reasons.append(">= 1000 customers impacted")
    if impact.data_exfiltration:
        reasons.append("confirmed or suspected data exfiltration")

    if impact.data_exfiltration or impact.customers_impacted >= 5000:
        return Severity.MAJOR, reasons
    if reasons:
        return Severity.SIGNIFICANT, reasons
    return Severity.MINOR, reasons

if __name__ == "__main__":
    sample = Impact(availability_minutes=72,
                    customers_impacted=1200,
                    data_exfiltration=False)
    sev, reasons = classify(sample)
    print(sev, reasons)
Wire this into your incident tooling (Jira, Statuspage, custom incident-bot) so classification is consistent and exportable.
3. Map SLOs directly to RTO/RPO for critical services
Regulators care about recovery time objective (RTO) and recovery point objective (RPO). Devs live in SLOs and error budgets. You need a clean mapping between the two.
Backlog item: Define per-service SLOs and document how they fulfil RTO/RPO for DORA-critical services.
Example (Prometheus + SLO annotations):
# slos.yaml
services:
  - name: payments-api
    rto_minutes: 60
    rpo_minutes: 5
    slo:
      objective: 99.9   # availability
      window_days: 30
      alerting:
        burn_rate_1h: 14.4   # fast burn
        burn_rate_6h: 6
  - name: auth-service
    rto_minutes: 30
    rpo_minutes: 5
    slo:
      objective: 99.95
      window_days: 30
Example (Prometheus alert rule derived from SLO):
# prometheus-rules.yaml
groups:
  - name: slo-alerts
    rules:
      - alert: PaymentsApiSLOBurningTooFast
        expr: |
          slo_error_rate_5m{service="payments-api"}
            > (1 - 0.999) * 14.4
        for: 5m
        labels:
          severity: page
          service: payments-api
        annotations:
          summary: "Payments API error budget burning too fast"
          description: "Check recent deploys & dependencies before SLO breach."
During the incident drill, you can show exactly how these SLOs align to RTO/RPO and how alerts would have fired.
4. Create a DORA incident record schema (and enforce it)
DORA wants consistent incident reports containing impact, root cause, timeline, and evidence.
Backlog item: Define an IncidentRecord schema and store incidents as immutable JSON objects.
{
  "$id": "https://example.com/schemas/dora-incident-record.json",
  "type": "object",
  "required": [
    "id",
    "classification",
    "servicesImpacted",
    "startTime",
    "detectionTime",
    "customersImpacted",
    "availabilityImpactMinutes",
    "dataExfiltration",
    "rootCause",
    "timeline",
    "evidenceBundleUri"
  ],
  "properties": {
    "id": { "type": "string", "format": "uuid" },
    "classification": { "enum": ["major", "significant", "minor"] },
    "servicesImpacted": {
      "type": "array",
      "items": { "type": "string" }
    },
    "startTime": { "type": "string", "format": "date-time" },
    "detectionTime": { "type": "string", "format": "date-time" },
    "customersImpacted": { "type": "integer" },
    "availabilityImpactMinutes": { "type": "integer" },
    "dataExfiltration": { "type": "boolean" },
    "rootCause": { "type": "string" },
    "timeline": {
      "type": "array",
      "items": {
        "type": "object",
        "required": ["time", "event", "actor"],
        "properties": {
          "time": { "type": "string", "format": "date-time" },
          "event": { "type": "string" },
          "actor": { "type": "string" }
        }
      }
    },
    "evidenceBundleUri": { "type": "string" }
  }
}
Make your incident tooling validate against this schema. For drills, treat incidents exactly as production: same schema, same evidence requirements.
5. Automate evidence bundles for every incident & drill
Your oversight teams and auditors need to see proof, not just descriptions. That means packaging logs, metrics snapshots, configs, and screenshots.
Backlog item: Create a script that builds a timestamped “evidence bundle” per incident/drill.
#!/usr/bin/env bash
# collect_evidence.sh
set -euo pipefail

INCIDENT_ID="$1"
STAMP="$(date -u +%Y%m%dT%H%M%SZ)"
BASE="evidence/${INCIDENT_ID}/${STAMP}"

mkdir -p "${BASE}"/{logs,metrics,configs,screenshots}

# Example: export logs (adapt to your logging backend)
kubectl logs -l app=payments-api --since=2h > "${BASE}/logs/payments-api.log"

# Example: snapshot metrics
curl -s "http://prometheus/api/v1/query?query=up" > "${BASE}/metrics/up.json"

# Example: capture key configs from Git
git show HEAD:infra/k8s/payments.yaml > "${BASE}/configs/payments.yaml"

tar -czf "evidence/${INCIDENT_ID}_${STAMP}.tar.gz" -C "evidence/${INCIDENT_ID}" "${STAMP}"

echo "evidence/${INCIDENT_ID}_${STAMP}.tar.gz"
During the incident drill, running this script should produce a bundle that your risk & compliance colleagues can attach directly to DORA-related reports.
For structured, third-party validation of your resilience controls, you can layer this with formal Risk Assessment Services and Remediation Services from Pentest Testing Corp, turning evidence into a real remediation roadmap rather than a one-off exercise.
6. Add resilience tests to CI/CD (not just unit tests)
DORA’s “digital operational resilience testing” doesn’t have to mean only large, manual TLPT-style exercises. You can push a lot of that into CI/CD: dependency outages, failover scenarios, and noisy-neighbor tests.
Backlog item: Add at least one automated resilience test per critical service into your pipeline.
Example (GitHub Actions + simple chaos test wrapper):
# .github/workflows/resilience.yml
name: Resilience Tests

on:
  push:
    branches: [ main ]
  workflow_dispatch: {}

jobs:
  api-resilience:
    runs-on: ubuntu-latest
    steps:
      - uses: actions/checkout@v4

      - name: Start dependencies
        run: docker-compose -f docker-compose.test.yml up -d

      - name: Run resilience tests
        run: |
          # Example: simulate DB outage for 30s during traffic
          python tests/resilience/simulate_db_outage.py

      - name: Archive resilience report
        uses: actions/upload-artifact@v4
        with:
          name: resilience-report
          path: reports/resilience/*
Use simple k6/Locust/pytest-based scripts to:
- Spike traffic while you restart a pod or kill a DB node.
- Measure failover time and error rate.
- Save a report to attach to your incident drill documentation.
7. Wire SLO & incident health into dashboards for drills
A drill is much more convincing when you can walk regulators and internal stakeholders through a single pane of glass showing:
- Which services are impacted.
- What SLOs are breached.
- Which customers/regions are affected.
Backlog item: Build a DORA-focused dashboard (Grafana, DataDog, etc.) that you can use live in drills.
At minimum, show:
- SLO status for all in-scope services.
- Incident count by classification (major/significant/minor) for the last 90 days.
- Open vs. closed remediation items (ideally fed by risk assessments and pentest findings).
Example (Postgres incident summary query):
-- incidents_last_90_days.sql
SELECT
  classification,
  COUNT(*) AS count,
  AVG(EXTRACT(EPOCH FROM (resolved_at - detected_at))/60) AS mttr_minutes
FROM incidents
WHERE detected_at >= NOW() - INTERVAL '90 days'
GROUP BY classification
ORDER BY classification;
You can embed this into a time-series panel to show incident trends ahead of a DORA oversight review.
8. Use the free Website Vulnerability Scanner to seed your backlog
Your ICT incident drill shouldn’t be based on hypothetical weaknesses. It should be grounded in real exposures on your perimeter.
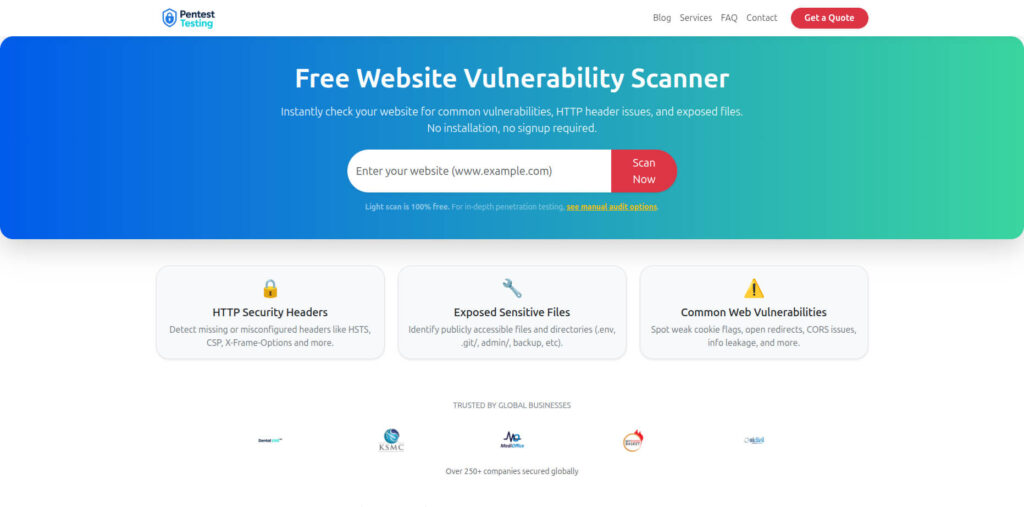
The free Website Vulnerability Scanner from Pentest Testing Corp lets you quickly scan your internet-facing hosts and get a vulnerability report you can plug straight into your backlog.
Backlog item: Run pre-drill and post-drill scans, and attach reports as evidence.
Suggested workflow:
- List all public URLs for DORA-relevant services (banking portals, APIs, admin consoles).
- Run the Website Vulnerability Scanner for each.
- Turn critical findings into remediation tickets, tagged
dora-exposure. - After fixes, rescan and attach “before/after” reports.
Screenshot of the Free Website Vulnerability Scanner landing page

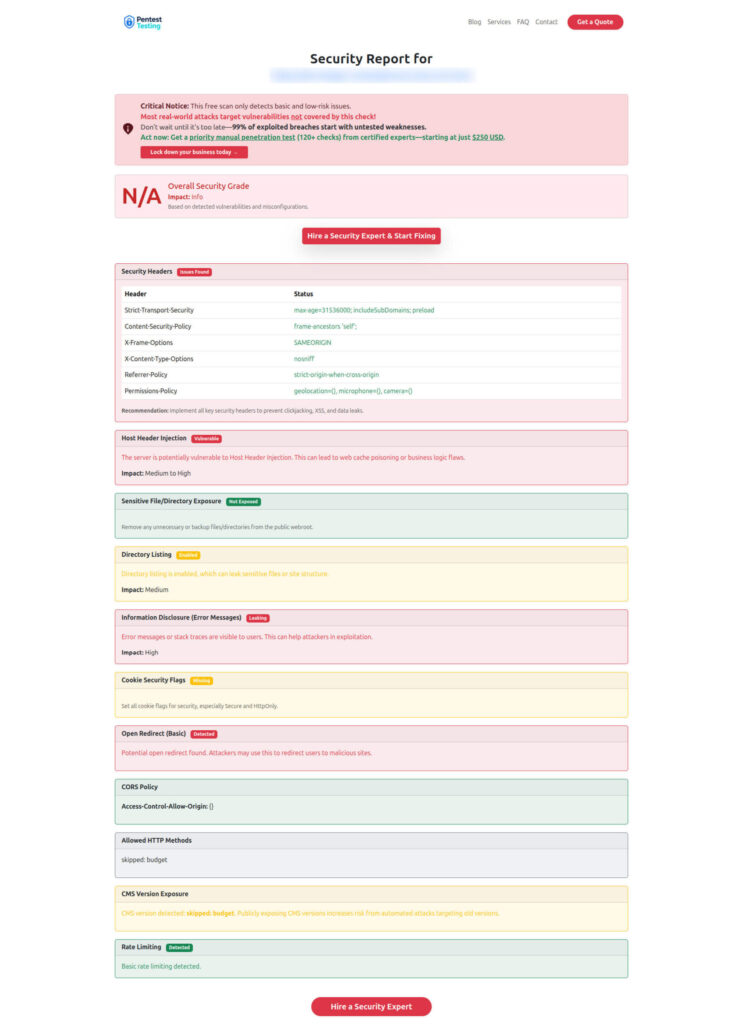
Sample assessment report to check Website Vulnerability

9. Encode DORA-relevant controls as code (policies, access, supply chain)
Many DORA controls overlap with secure-by-default engineering patterns: IAM hygiene, supply-chain hardening, and logging standards. Cyber Rely already publishes developer-first patterns you can re-use: for example, software supply chain security tactics, PCI DSS remediation patterns, and TypeScript logging best practices.
Backlog item: Turn key DORA-related controls into “policy as code” in CI.
Example (Open Policy Agent for CI pipeline):
package cicd.dora

violation[msg] {
  some pipeline
  input.pipelines[pipeline].name == "deploy-critical-service"
  not input.pipelines[pipeline].requires_approval
  msg := sprintf("Critical pipeline %s must require manual approval", [pipeline])
}

violation[msg] {
  some pipeline
  input.pipelines[pipeline].name == "deploy-critical-service"
  not input.pipelines[pipeline].requires_change_ticket
  msg := sprintf("Critical pipeline %s must reference a change ticket", [pipeline])
}
Feed data about pipelines (from GitHub/GitLab API) into this policy and block non-compliant changes.
10. Drill playbooks with devs, not just risk & ops
The best DORA drills are cross-functional: developers, SREs, security, and risk teams using the same playbooks and tools.
Backlog item: Create a “DORA Drill Kit” in your repo:
playbooks/incident-major-outage.mdrunbooks/service-failover.mdchecklists/dora-incident-drill.mdevidence/folder structure and automation scripts.
Example snippet from a DORA incident drill checklist:
# DORA ICT Incident Drill – Checklist

- [ ] Declare simulated incident in incident tooling with `classification = major`.
- [ ] Start evidence bundle script and record artifact URI.
- [ ] Capture SLO dashboard screenshot before and during impact.
- [ ] Log all decisions in #incident-war-room Slack channel.
- [ ] At end, export incident record JSON and attach to drill report.
- [ ] Capture list of remediation items and map to owners + due dates.
After the drill, hand the outputs to your partners at Pentest Testing Corp for a structured Risk Assessment and Remediation plan that’s explicitly aligned to DORA controls rather than generic “best practices.”
How Cyber Rely + Pentest Testing Corp fit together
- Cyber Rely focuses on the developer playbook — patterns, snippets, and CI/CD wiring that help your teams move fast while staying in line with DORA, NIS 2, PCI DSS, and similar frameworks.
- Pentest Testing Corp provides the formal assurance layer:
- Independent, DORA-aware Risk Assessment Services (PCI, SOC 2, ISO, HIPAA, GDPR, and more).
- Hands-on Remediation Services that convert findings into closed tickets and auditor-ready evidence.
- The free Website Vulnerability Scanner to continuously test your external surface.
Together, you get a pipeline where dev teams ship resilient systems and your risk/compliance teams have the evidence they need for DORA oversight and ICT incident reporting.
Related Cyber Rely blog posts to go deeper
When you publish this article on the Cyber Rely blog, consider linking internally to these recent, developer-focused guides:
- 7 Proven Software Supply Chain Security Tactics – CI patterns for SBOM, VEX, and SLSA that align with DORA’s supply-chain expectations.
- npm supply chain attack 2025: ‘Shai-Hulud’ CI fixes – incident-style response playbook for active supply-chain abuse.
- 10 Best Practices to Fix Insufficient Logging and Monitoring in TypeScript ERP – concrete examples to strengthen logging before your DORA drill.
- PyTorch Supply Chain Attack: Dev Guardrails – great complement for ML-heavy stacks in financial services.
You can now take this Developer Playbook for DORA, turn each of the 10 steps into actionable tickets, and go into your next ICT incident drill with confidence — backed by real code, real telemetry, and real evidence.
🔐 Frequently Asked Questions (FAQs)
Find answers to commonly asked questions about Developer Playbook for DORA.